Each month the Tucson Association of Realtors® Multiple Listing Service comes out with Tucson’s monthly housing report. The numbers are out for the Tucson residential real estate market report July 2016.
Check out what home prices are doing in Tucson, AZ for July 2016.
Highlights of the Tucson Residential Real Estate Market Report for July 2016 are below:
- Total Sales Volume decreased 20.56%, going from $384,524,826 in June to $305,485,314 in July.
- The Average Sales Price of $218,985 is a decrease of 6.72% from June’s number of $234,752 but an increase of 4% over July 2015.
- Average List Price of $224,771 decreased 6.57% from June’s number of $240,584 but an increase of 3.69% over July 2015.
- Total Under Contract decreased by 7.50% since June.
- Total Unit Sales of 1,395 decreased 14.84% since June’s number of 1,638.
- The Median Sales Price fell to $181,500 this month from $190,000 last month, a 4.47% decrease.
- New Listings decreased to 1,677 from 1,917 in June and are down 4.99% from July 2015.
- Total Active Listings of 3,936 is a decrease of 5.72% since June’s number of 4,175.
- Average Days on Market of 50 is a significant decrease from 57 in June.
- Conventional loan sales of 39.3% exceeded Cash Sales of 21.6%.
These numbers can be positive or negative depending on which side of the fence you are on… Buyer or Seller?
Below are some important charts of data we compiled to give you a visual of how the Tucson housing market is trending for July 2016.
 Total real estate sales in Tucson for the month of July 2016 were 1,395 units sold. Which was a decrease of 15% from the previous month.
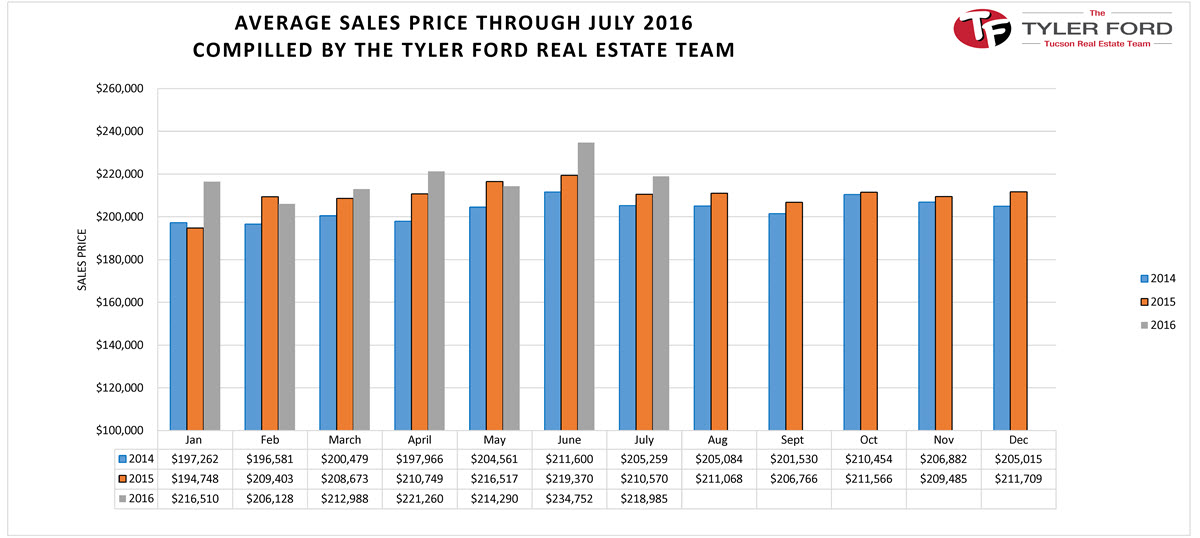 In July 2016, the average sales price of a home in Tucson, Arizona was $218,985. Which was a decrease of 6.72% from June 2016 as shown in the chart above.
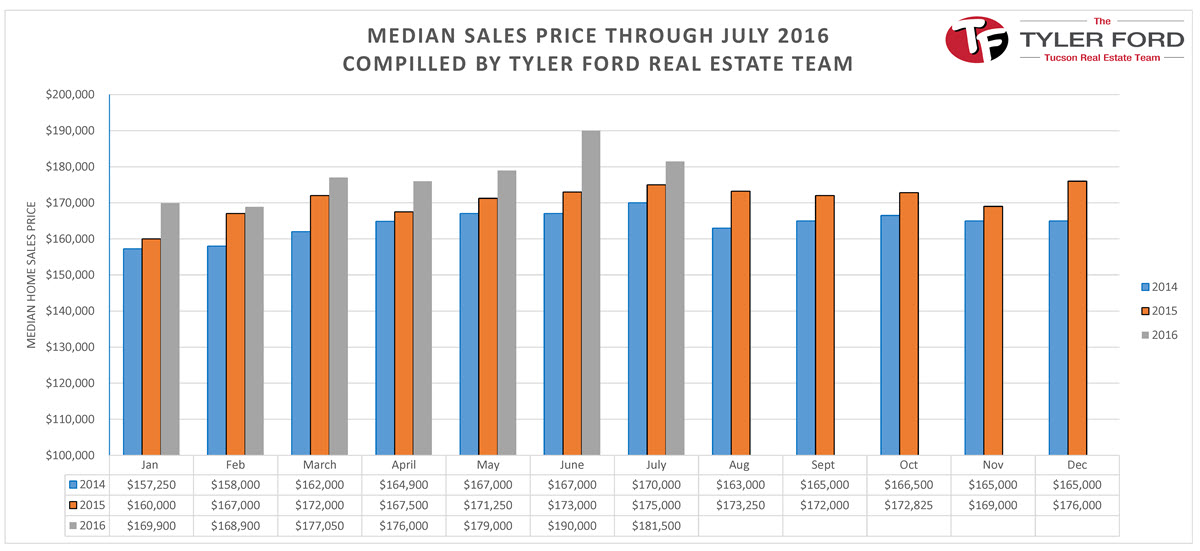 In July 2016, the median sales price of a home in Tucson, Arizona was $181,500. Which was an a decrease of 4.47% from June 2016 as shown in the chart above.
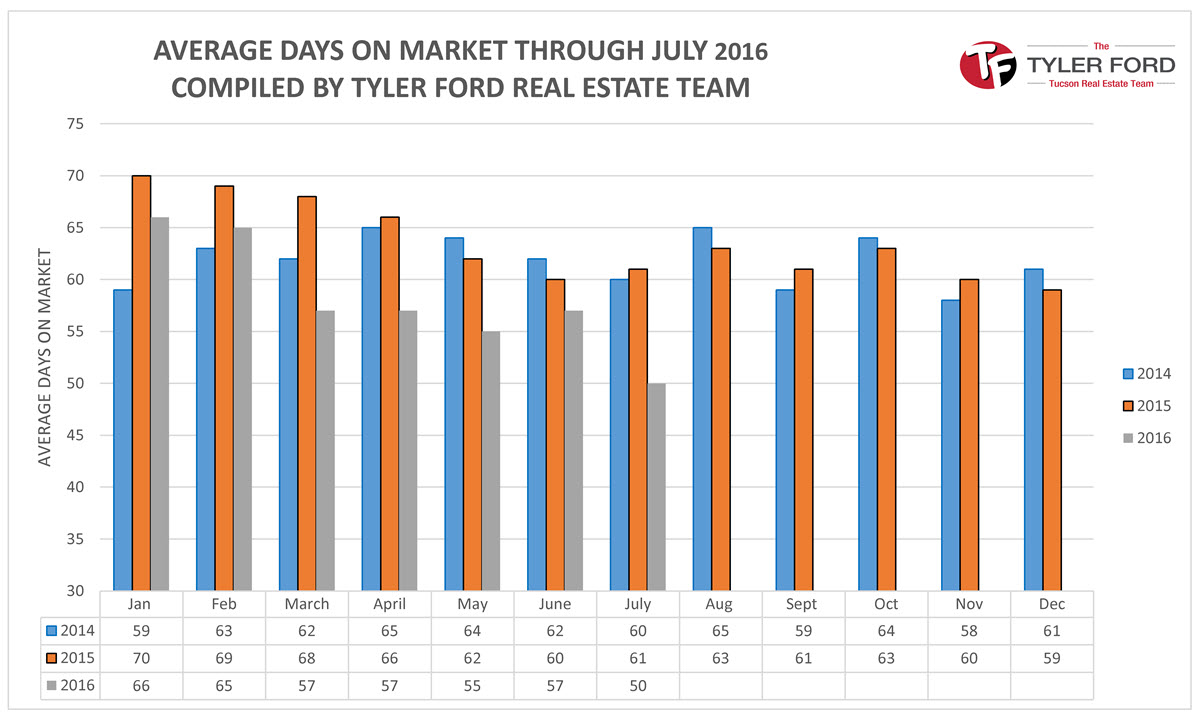 As of July 2016, the average days a home was on the market was 50 days. Which is 7 days less than the previous month and 11 days less than the previous year as shown in the chart above.
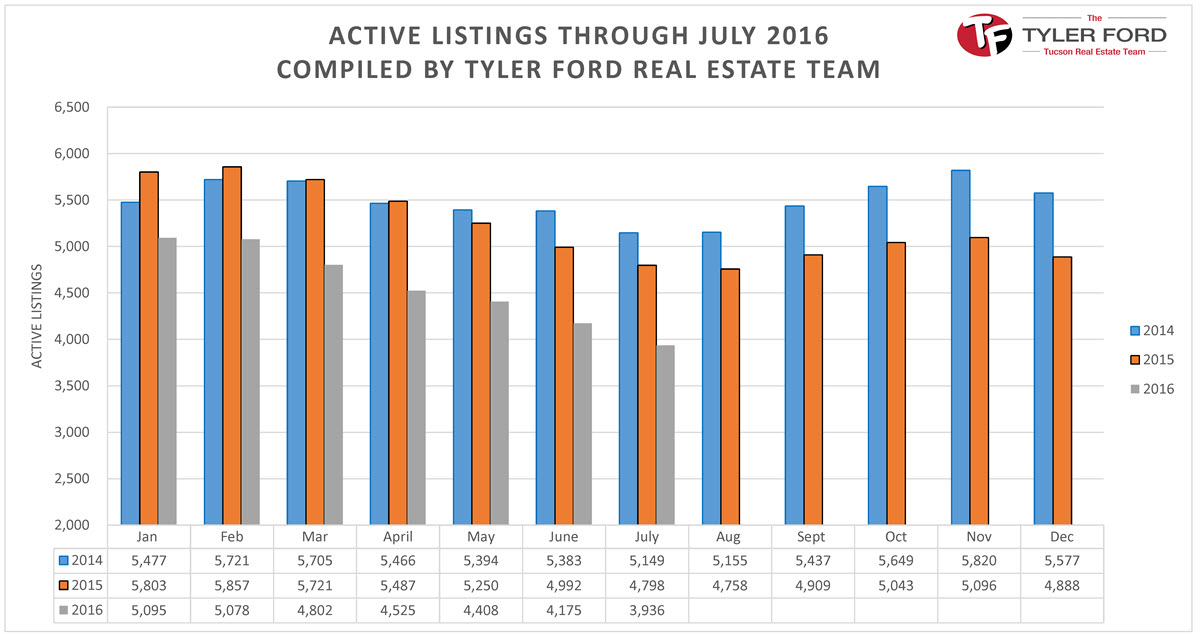 The number of active listings in Tucson, Arizona in the month of July 2016 was 3,936 listings as shown on the chart above.
This number is one to keep an eye on.
If this down trend in inventory continues look for the market to strengthen and prices to move up which sets up for a sellers market.
TUCSON HOME BUYERS
As home inventory levels begin to decrease there is less to chose from. So when you see a home that you like that is properly priced moving quickly is key in getting your offer accepted.
TUCSON HOME SELLERS
As the number of listings decrease sellers are poised to sell their home faster and for more money. Marketing and making your home look great are keys to selling your home FAST and for MORE MONEY.
As a seller, your home is one of three listings:
- The home that sells!
- The home that gets showings but sells the house down the road.
- The home that gets no showings and does not sell.
Which type of listing do you want to be?
SOLUTION
Having a skilled real estate team is the key to saving thousands of dollars when buying or selling a home with the least amount of hassles. Put the Tyler Ford Real Estate Team to work for you. We would love to earn your business!
Sell your Tucson, AZ home in 90 days or its FREE!
LINKS
The difference between average and median?
For a complete breakdown of Tucson Home Prices Monthly Statistics for July 2016: CLICK HERE
Tags: Tucson Home Prices