Highlights of Tucson’s Residential Housing Market for March 2018:
*** Watch the video below ***
Each month the Tucson Association of Realtors® Multiple Listing Service comes out with  Tucson’s monthly housing report. The numbers are out for the Tucson residential housing market report for March 2018.
In March 2018, the Tucson housing market showed signs of a strength heading into 2018. Inventory levels continue to remain low putting upward pressure on home values and lowering the average days a home is on the market.
Check out what home prices are doing in Tucson, AZ March 2018.
Highlights of the Tucson Residential Housing Market Report for March 2018 are below:
- Total Sales Volume this month of $360,404,000 is an increase of 33.47% from last month’s number of $270,019,575.
- The Average Sales Price of $246,514 is a decrease of 1.04% from $249,095 in February.
- Average List Price of $246,514 is a decrease of 3.43% from last month’s number of $255,269.
- Total Under Contract increased from 1,998 in February to 2,157 this month.
- Total Unit Sales jumped from 1,084 in February to 1,462 this month, up 34.87%, but down by .07% from March 2017.
- The Median Sales Price of $210,000 is up 1.45% from $207,000 in February, and up 6.60% since this time last year.
- New Listings increased to 1,962 from 1,776 last month.
- Total Active Listings of 3,186 decreased from last month’s number of 3,293, a 3.25% drop.
- Average Days on Market dropped to 43 from 49 last month.
- Conventional loan sales of 43.6% exceeded Cash Sales of 27.6%.
These numbers can be positive or negative depending on which side of the fence you are on… Buyer or Seller?
Below are some important charts of data we compiled to give you a visual of how the Tucson housing market is trending for March 2018.
CLICK ON THE CHARTS BELOW TO SEE THEM BIGGER.
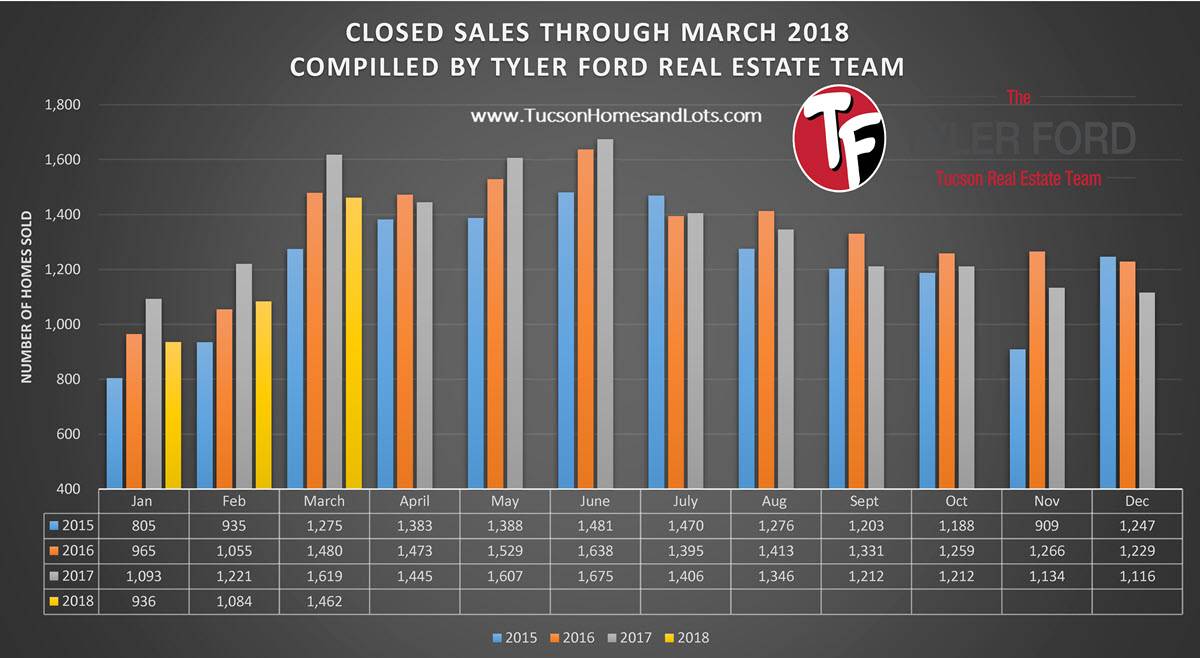
Total real estate sales in Tucson for the month of March 2018 were 1,462 units sold. Which was up 34.87% from the previous month as shown in the chart above.
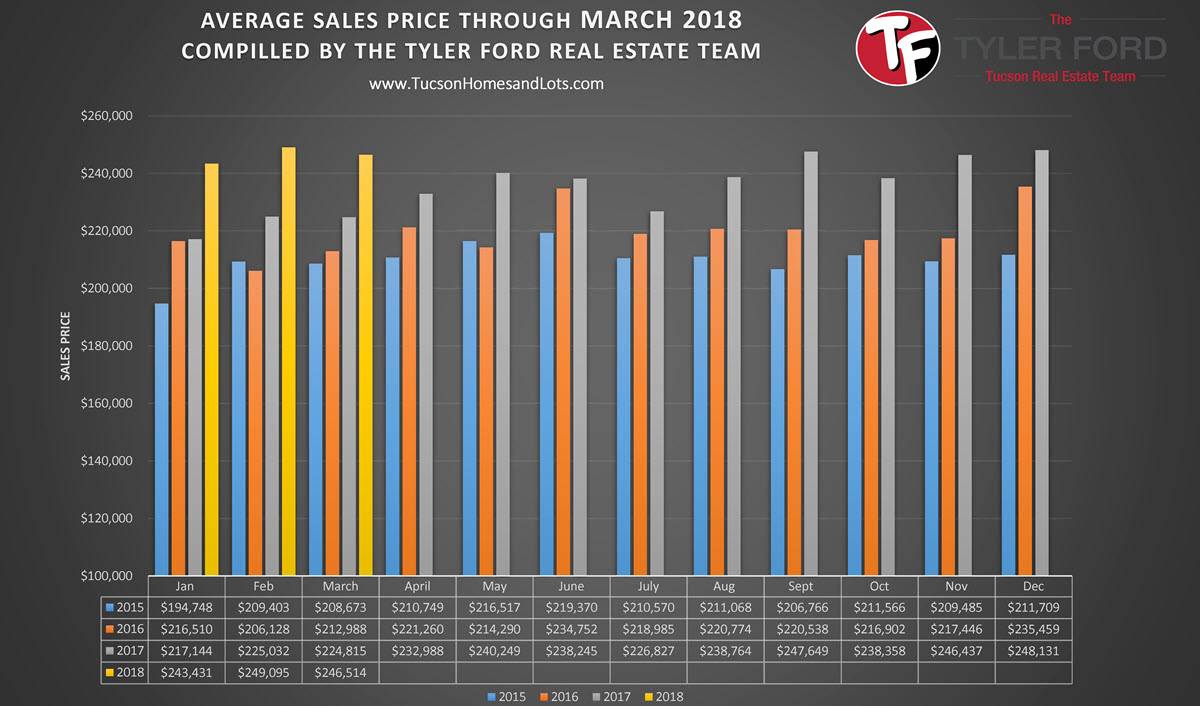
In March 2018, the average sales price of a home in Tucson, Arizona was $246,514. Which was a decrease of 1.04% from the previous month as shown in the chart above.
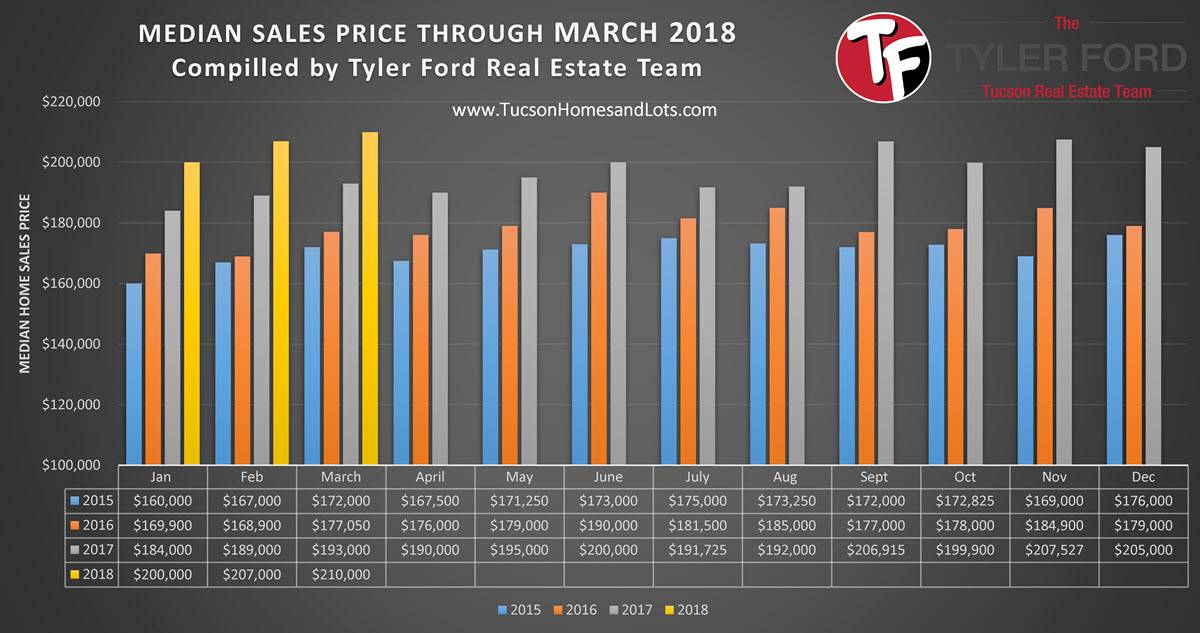
In March 2018, the median sales price of a home in Tucson, Arizona was $210,000. Which was an increase of 1.45% from the previous month as shown in the chart above.
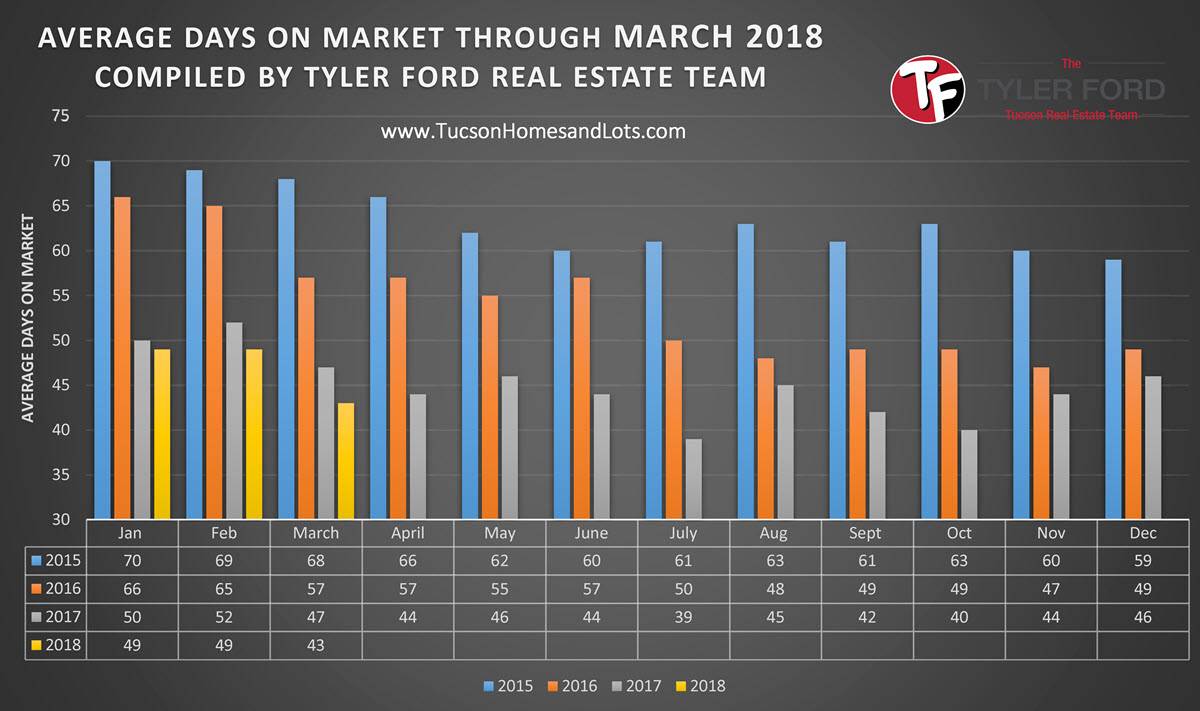
In March 2018, the average days a home was on the market was 43 days. Which was a decrease of 6 days from the previous month and 4 days less than the previous year as shown in the chart above.
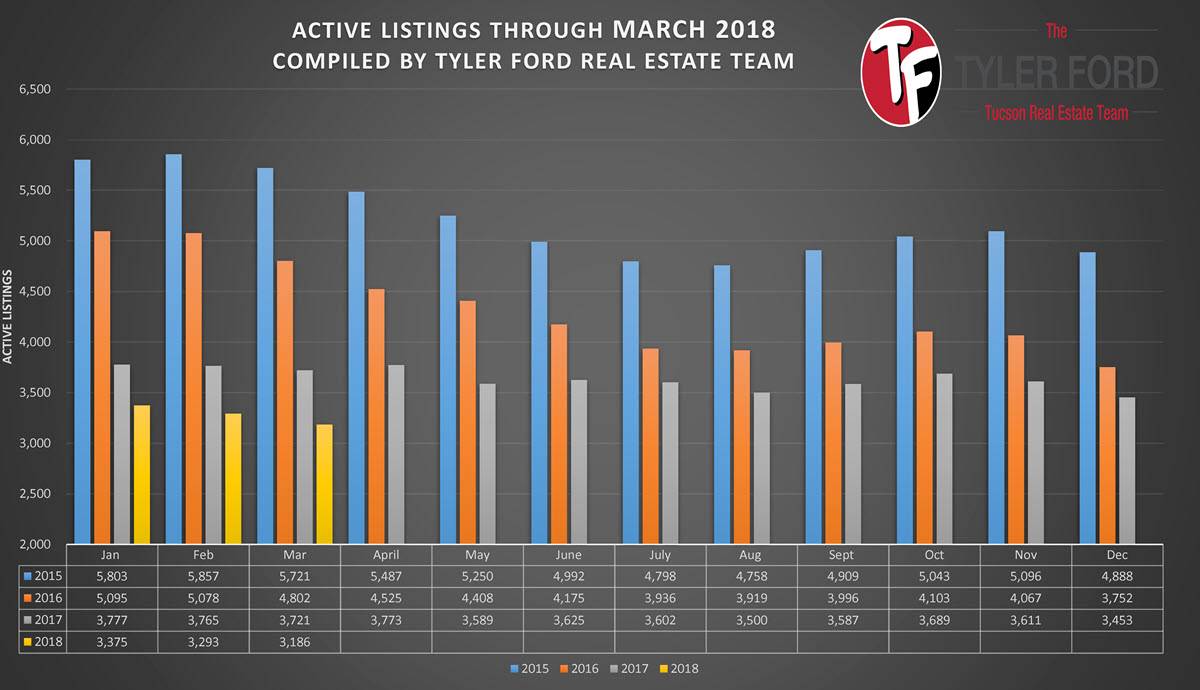
The number of active listings in Tucson, Arizona in the month of March 2018 was 3,186 listings, which is a 3.25% decrease from the previous month as shown in the chart above.
This number is one to keep an eye on.
If this downward trend in inventory continues, look for the market to continue to strengthen and prices to move up which has created a seller’s market in Tucson, Arizona.
TUCSON HOME BUYERS
As home inventory levels begin to decrease there is less to chose from. So when you see a home that you like that is properly priced moving quickly is key to getting your offer accepted.
TUCSON HOME SELLERS
As the number of listings decreases sellers are poised to sell their home faster and for more money. Marketing and making your home look great are keys to selling your home FAST and for MORE MONEY.
As a seller, your home is one of three listings:
- The home that sells!
- The home that gets showings but sells the house down the road.
- The home that gets no showings and does not sell.
Which type of listing do you want to be?
SOLUTION
Having a skilled real estate team is the key to saving thousands of dollars when buying or selling a home with the least amount of hassles. Put the Tyler Ford Real Estate Team powered by eXp Realty in Tucson to work for you. We would love to earn your business!
LINKS
The difference between average and median?
FOR A COMPLETE BREAKDOWN: CLICK HERE